

"Efficient AWS EC2 Instance Metrics and Logs Collection: A Step-by-Step Guide Using Telegraf, InfluxDB, Grafana, and Docker Compose"


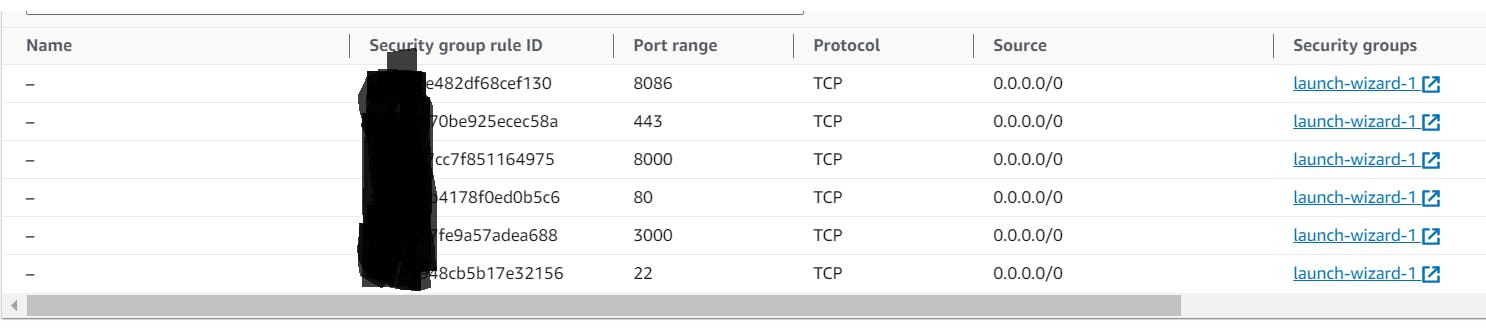
Step 1: Simply create the EC2 instance now inside the security group change the inbound rules,
Telegraf - InfluxDB - Grafana
let's simply understand what each tool helps to attain the required data to be collected using telegraf, stored in the InfluxDB and visualize them simply, now detailed view of metrics collection can be seen using Grafana.
Telegraf:
Telegraf is a data collection and reporting agent.
It gathers data from various sources like systems, databases, and applications.
Telegraf is highly customizable and can be configured to collect specific metrics.
It sends the collected data to a storage system like InfluxDB.
InfluxDB:
InfluxDB is a time-series database designed to handle time-stamped data.
It stores data points along with a timestamp, making it ideal for time-based data, like system metrics or sensor readings.
InfluxDB is known for its high performance and scalability.
It can store and retrieve data efficiently for use in analytics and visualization tools.
Grafana:
Grafana is a visualization and monitoring platform.
It connects to various data sources, including InfluxDB.
Grafana allows you to create customizable dashboards to visualize and analyze data.
You can build graphs, charts, and other visualizations to gain insights from your data.
It's a powerful tool for real-time monitoring and historical data analysis.
Step 2 :
Now, use docker-compose file,
In the provided YAML configuration, we have defined a Docker Compose setup to orchestrate the deployment of three essential components: Telegraf, InfluxDB, and Grafana, which collectively form a robust solution for data collection, storage, and visualization.
The 'telegraf' service is configured to use the Telegraf image and load a configuration file ('telegraf.conf') from the local filesystem. It connects to the 'influxdb' service and exposes port 8125 for data ingestion.
The 'influxdb' service utilizes the InfluxDB image, setting up a database named 'influx' and specifying an admin user and password for authentication. Port 8086 is exposed, and data is persisted in a volume named 'influxdb_data.'
Finally, the 'grafana' service deploys the Grafana image, with a specified admin user and password. It depends on 'influxdb' for data access, and port 3000 is exposed for Grafana's web interface. Grafana's data is stored in a volume called 'grafana_data.'
This configuration streamlines the integration of these tools, making it easier to collect, store, and visualize time-based data efficiently.
docker-compose.yml
version: '3.6'
services:
  telegraf:
    image: telegraf
    container_name: telegraf
    restart: always
    volumes:
      - /path/to/directory/telegraf.conf:/etc/telegraf/telegraf.conf:ro
    depends_on:
      - influxdb
    links:
      - influxdb
    ports:
    - '8125:8125'

  influxdb:
    image: influxdb
    container_name: influxdb
    restart: always
    environment:
      - INFLUXDB_DB=influx
      - INFLUXDB_ADMIN_USER=admin
      - INFLUXDB_ADMIN_PASSWORD=admin
    ports:
      - '8086:8086'
    volumes:
      - influxdb_data:/var/lib/influxdb

  grafana:
    image: grafana/grafana
    container_name: grafana-server
    restart: always
    depends_on:
      - influxdb
    environment:
      - GF_SECURITY_ADMIN_USER=admin
      - GF_SECURITY_ADMIN_PASSWORD=admin
      - GF_INSTALL_PLUGINS=
    links:
      - influxdb
    ports:
      - '3000:3000'
    volumes:
      - grafana_data:/var/lib/grafana

volumes:
  grafana_data: {}
  influxdb_data: {}
The Telegraf configuration file, often named "telegraf.conf" is required to customize and define how Telegraf collects, processes, and sends data to various outputs.
telegraf.conf
[global_tags]

[agent]
  interval = "5s"
  round_interval = true
  metric_batch_size = 1000
  metric_buffer_limit = 10000
  collection_jitter = "0s"
  flush_interval = "10s"
  flush_jitter = "0s"
  precision = ""
  #hostname = "184.73.76.161"
  hostname = "<required name>"
  omit_hostname = false

[[outputs.influxdb_v2]]
  urls = ["http://influxdb:8086"]
  bucket = "bucket name"
  token = "<InfluxDB given API token>"
  organization = "<given name of organization while setup>"
  timeout = "5s"
 # username = "name"
 # password = "password"


[[inputs.cpu]]
  percpu = true
  totalcpu = true
  collect_cpu_time = false
  report_active = false


[[inputs.disk]]
  ignore_fs = ["tmpfs", "devtmpfs", "devfs", "iso9660", "overlay", "aufs", "squashfs"]

[[inputs.mem]]

[[inputs.processes]]

#[[inputs.nstat]]
#  interfaces = ["eth0"]  # Add this line to specify the network interface to monitor

# Collect statistics about itself
[[inputs.internal]]
  ## If true, collect telegraf memory stats.
  collect_memstats = true
  # collect_memstats = true
Step 3:
now we can able to see the docker images of three containers Telegraf, InfluxDB, Grafana by opened in their respective port number,
3000 for Grafana
8086 for influxdb
in the terminal check the logs of telegraf of what it generated first using
Now, open the InfluxDB docker container, enter the command
docker exec -it influxdb /bin/bash
And give the below setting up inputs by customizing it accordingly,
influx config create --config-name
--host-url http://<ip address> <br>--org <organization name> <br>--token <InfluxDB provided API token> <br>--active
Check, by entering the below command to see the entry has been created,
influx config list
now check the telegraf log,
docker logs telegraf
there wont be any error should occur if happen check with all the file indentation, and customized input check,
Step 4:
Enter Inside the influxDB with http://<ip address>:8086/
fill the columns of
username, password, organization name, bucket
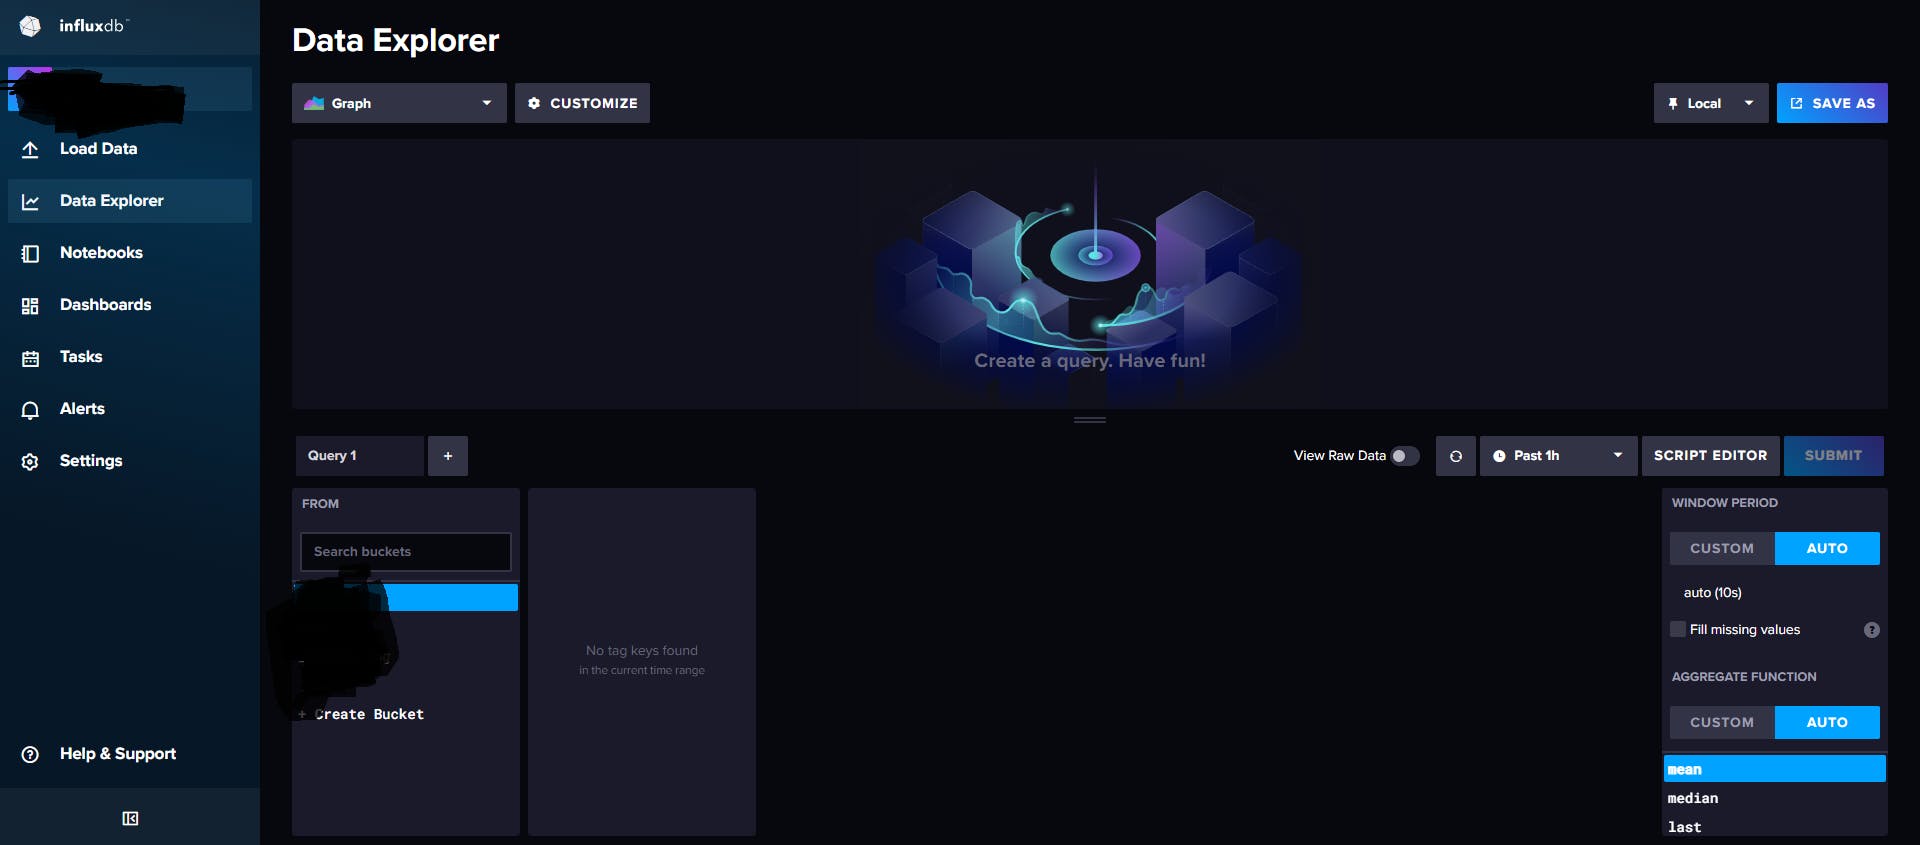
get inside the created bucket to see the entries in the
inside the Data Explorer
data explorer the created bucket must receive the metric data since the point of the docker image started running inside,
so let's check with the hierarchy basis and the provided inputs in the telegraf.conf file.
[[inputs.cpu]]
[[inputs.disk]]
[[inputs.mem]]
[[inputs.processes]]
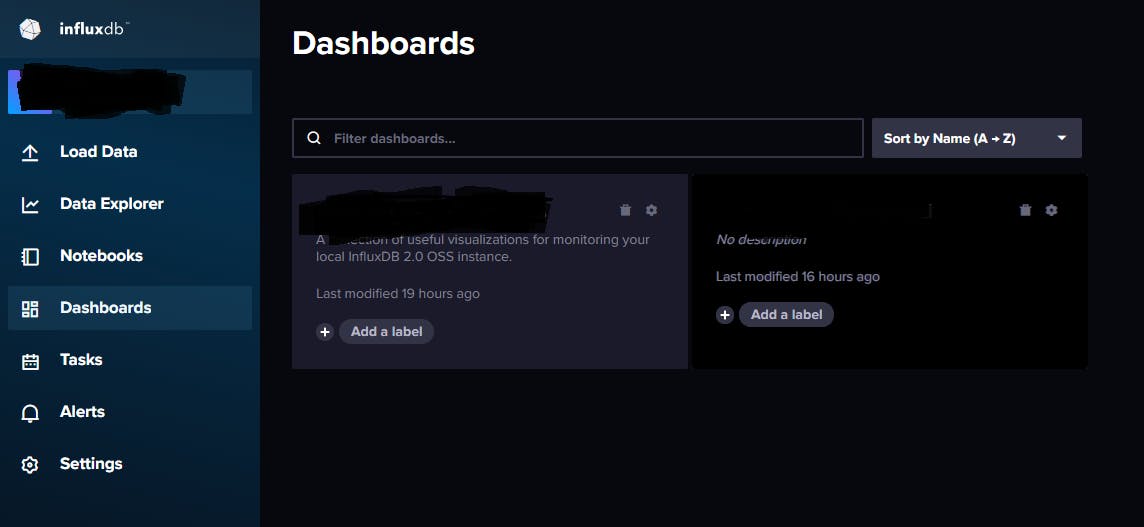
and check with the bucket and see the preceded way possible to all the metadata as well in the hierarchy basis of provided input. create a dashboard in that section of Dashboards,
Now on the Grafana dashboard viewing metrics aspect, we'll be configuring influxdb inside the data source once we open the grafana port 3000.
In there select InfluxDB data source, provide the information of name,
Name
Query language as Flux
HTTP the influxDB ipaddress with port
straight to InfluxDB Details [Organization, API token, default Bucket name]
save & test
Once the process gets over, get back to the same data source,
you can see the created data source of whatever the name we gave in that section, in that get into -> Build a dashboard -> add visualization ->
down the run query section put the flux query language script that creates itself when we select from the bucket list, put the script here in the Grafana query running section, refresh them,
you get to see the visualization of the same metric we see in influxDB, same them used for future reference to know about the data and metrics running, name them and save it.
Step 5:
- So, we get to see the Dashboard displaying the metrics of time-based inputs using telegraf working as an agent to send data to influxdb and that again set scripting input to provide the same visualization in more detailed manner in grafana dashboard.

now we can store the dashboard and able to check the updates according to the time limits we set.